From perf stat PROGRAM We get information like:
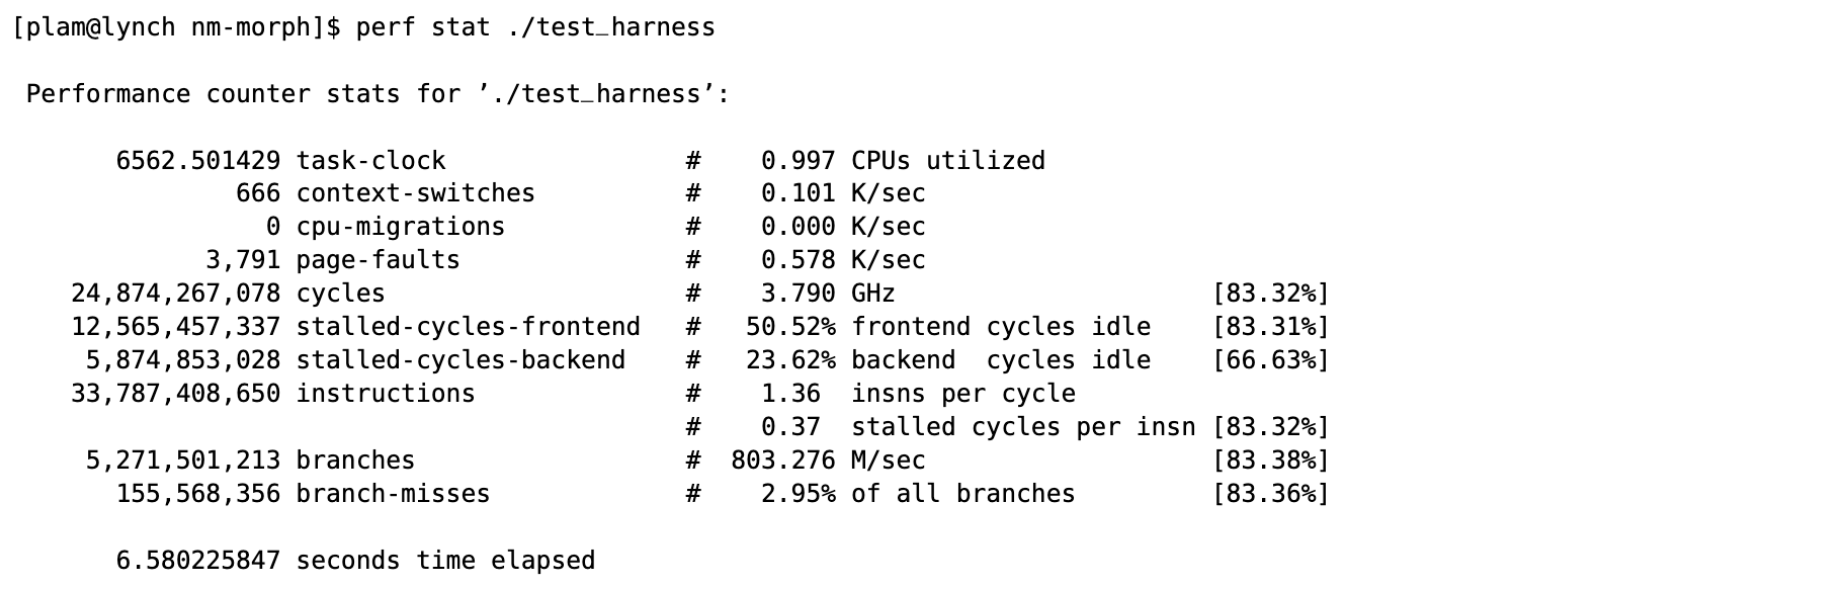
Here, we can see the total execution time of the program. If we improve a program:
- Less page faults
- Less branch misses
- Less instructions per cycle (less work) The goal is to decrease the total time elapsed.
To get useful information, we need to add [profile.release] and debug=true to the toml. This means that when we build, we will compile with debug information. This will slow down the program. Probably re-establish a baseline? Then we run the program using perf record to sample the execution of the program to produce a data set. Then we can look at the code using:
perf reportperf annotateflamegraph