Sequence Diagrams
- Shows step-by-step what’s involved in a use case
- Relavant objects
- How the objects participate
- You might need several sequence diagrams to describe a single-use case
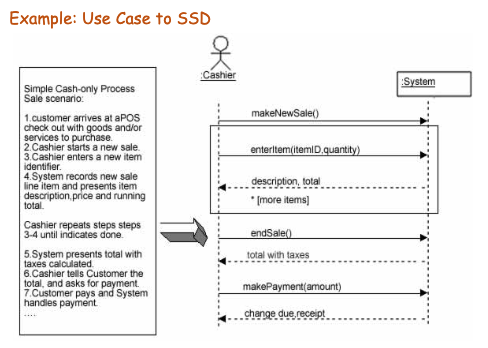
- Shows all events external actors generate, their order, inter-system events.
- here, all systems are treated as a black box. The point of this diagram is that events cross the system boundary from actors to the system
Syntax
- The vertical line is the lifeline (life during an interaction)
- Object deletion is denoted by an X which ends a lifeline
- Horizontal arrows are messages between two objects
- Order of messages happen from top to bottom
- Messages should be labeled with a message name
- Synchronous: Solid arrow and tip, waits for return
- Asynchronous: Solid arrow body with open arrow tip
- Return messages: Open tip and dashed line
- Control information can be expressed as condition s[hasStock]
- Returns (dashed lines) are optional
- Here you can see that the system is a black box and that the SSD shows operations of the System in response to events in temporal order
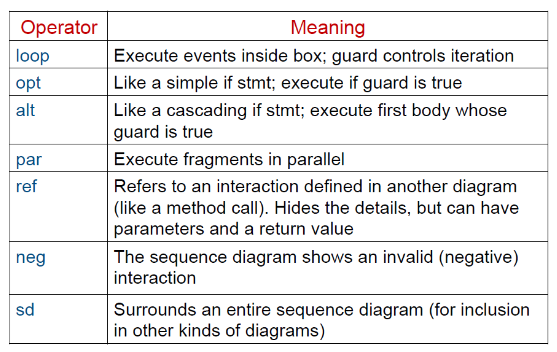
- Rectangles are ifs or interaction frames (see below)
- In general all frames have:
- A rectangle to limit scope
- A name
- A guard
- Maybe multiple regions
- Alts are alternatives which are if else statements
- Opts mean optional which is an if without the else
- In general all frames have:
- Underline classes (implies instance)
Rules of thumb
- Try not to use opt, loop, alt/else
- Crease sequence diagrams for use cases when it helps clarify and visualize complex flows