General Rules
General rules for approximate graphing
- Your magnitude break points are or the s roots in the numerator and denominator
- Your phase angle break points are 10x and 0.1x of each magnitude break point
- Given a transfer function
- Identify Poles and Zeroes
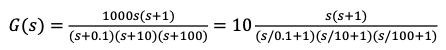
- Transform into Bode forms (normalized forms)
- These forms look like this:
- You may need to complete the square?
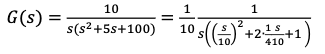
- These forms look like this:
- List the breakpoints in ascending order
- For magnitude plots:
- For phase plots: where you list them basically in the same order by also by the front magnitude
- Continue plotting for subsequent breakpoints
- At each breakpoint, change the slope accordingly (for magnitudes)
- Ex. for a 1st order breakpoint, change the slope by 20, for a 2nd order, change the slope by 40
- The change is positive for zeros and negative for poles
- The last line needs a slope of -20
- At each point (0.1x and 10x), change the slope accordingly (for phases)
- For each 0.1x point, If it is for the 1st order term, change the slope by 45°, for a 2nd order, change the slope by 90°
- The change is positive for zeros and negative for poles
- For each 10x point, do it in negative way
- The final line must lie flat with a slope of -90°
- At each breakpoint, change the slope accordingly (for magnitudes)
- If there is an in the TF, it changes the first line segment of the Bode plot
- Here, we draw the first line of the magnitude plot with a slope of 20p and its value at
- Draw the first line of the phase plot with a flat line with °
- If any break point coincides with the other one, apply the rules multiple times according to each rules