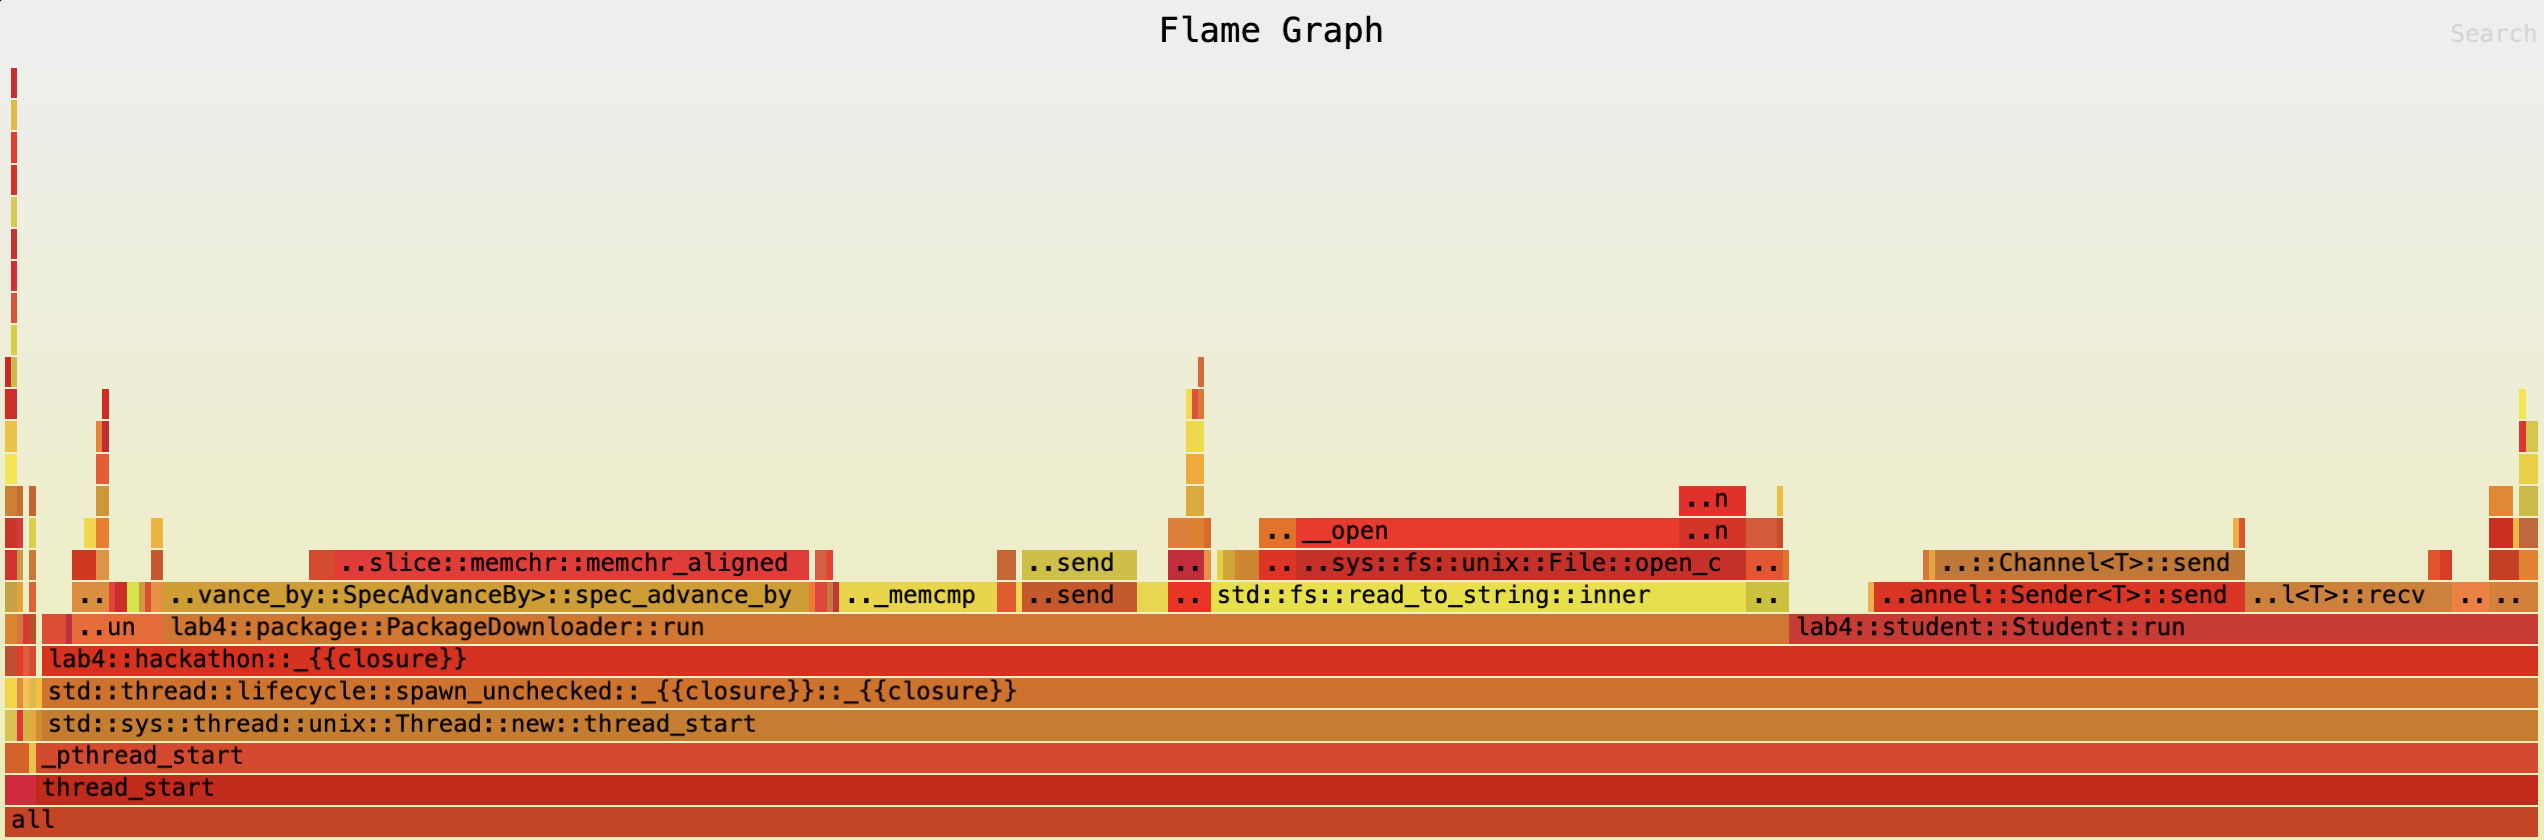
This is a stack trace visualizer. We can see all the methods called per thread (or in all threads) and what function calls what as well as the percentage breakdown of how time is spent.
- Functions that call functions are stacked
- The time that they take is the horizontal span
Most of the things at the bottom are just for starting up the program.
IDE’s like the JetBrains suite provide a profiler tool that generates this for you.
Note
We are interested in:
- Things that take a long time
- Why things take a long time
- Why is a call stack so high?
- The bar below calls the bar above