For sorting requirements by their potential value and cost…
- Value is a requirement’s potential contribution to customer satisfaction
- Cost is the cost of implementing the requirement
- Can prioritize requirements according to their cost-value ratios
- Absolute values and costs are complex to estimate
- Relative comparisons are easier
- Based on the Analytic Hierarchy Process (AHP); an approach for supporting decision-making.
Includes five steps…
-
The requirements engineers review the candidate requirements to ensure that the requirements are complete and clearly defined
-
Customers and users determine the relative value of each requirement using the pairwise comparison method of the AHP, which includes five steps.
- Compare pairs of requirements
- 1 - requirements are of equal value
- 3 - one is slightly preferred over the other
- 5 - one is strongly preferred over the other
- 7 - one is very strongly preferred over the other
- 9 - one is highly preferred over the other
- Intermediate values 2, 4, 6, and 8 used when compromise is needed
- If pair (x,y) has relative value n, complementary pair (y,x) has reciprocal value 1/n
- Normalize the columns
- Sum each row
- Normalize sums
- Report relative values
- Note: We do data Normalization when seeking for relations.
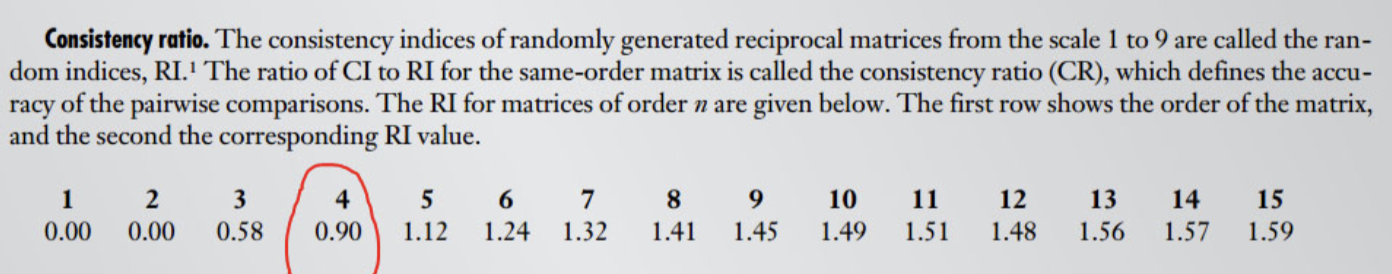
- Check Consistency
- The consistency index is the first indicator of the result accuracy of the pairwise comparison
- Multiply comparison matrix by priority vector
- Divide each element by the corresponding element in priority vector
- Compute principle eigenvalue
- Calculate consistency index
- Compare against consistency index of random matrix <0.1
- CI shows the deviation of consistency
Random Matrices
- Compare pairs of requirements
-
Perform Step 2 of AHP to estimate relative cost
-
Create a cost-value diagram where the value is depicted on the y-axis, and the cost is depicted on the x-axis
- Advantages:
- Unbiased
- Scientific
- Check if errors
- Disadvantage:
- Difficult
- Lack of understanding of the results
- Advantages:
-
Stakeholders use the cost-value diagram as a conceptual map for analyzing and discussing the requirements